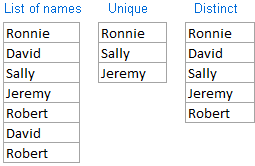
In this tutorial you will learn how to count unique values in Excel with formulas, and how to get an automatic count of distinct values in a pivot table.
We will also discuss a number of formula examples for counting unique names, texts, numbers, case-sensitive unique values, and more.
Specifically:
- Count unique values in a column.
- Count unique text values.
- Count unique numbers.
- Count case-sensitive unique values.
- Count distinct values ignoring blank cells.
- Formula to count distinct text values.
- Formula to count distinct numbers.
- Counting case-sensitive distinct values.
- How to count unique and distinct rows in Excel.
- Automatic count of distinct values in a pivot table.
Full article: How to count distinct and unique values in Excel
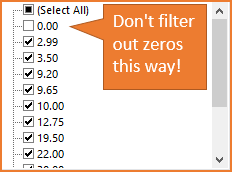
Often times we are working with a list or data set that contains a lot of zeros in a column. We might want to filter these zeros out to shorten the list, so that we only see numbers that are greater than or less than zero. One easy way to do this is to uncheck the zero (0) item in the filter drop-down box.
However, this can produce unexpected results. Learn the correct way to filter out zeros and numbers with the filter drop-down menus in Excel, and avoid embarrassing mistakes.
Full article: How to properly filter zeros and numbers with the Filter drop-down menus
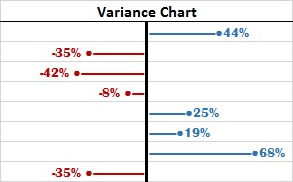
Whether it is in daily life or at work, we are always making comparisons to see what's good and what is not so good. This differential analysis is called variance analysis.
Here are 10 techniques to take variance analysis beyond simple numbers and percentages:
- Use brackets for negative numbers.
- Color the content or data – custom number format.
- Use arrows.
- Use cell color.
- Use arrows – Conditional Formatting.
- Use data bars.
- "In-cell" charts.
- Use scaled-down actual charts.
- Make better variance charts.
- Highlight instances in chart.
Full article: 10 ways to present variance analysis reports in Excel
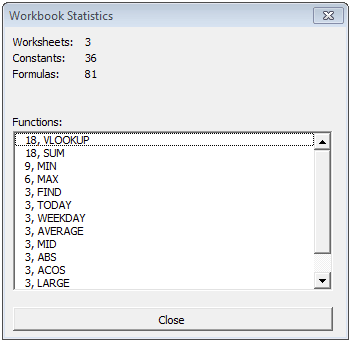
In Excel we often like to count things. Sometimes those things are cells with text, formulas or formatting. Other times we want to count blank or non-blank cells… and so on.
This article teaches you all about counting things in Excel, using:
- Worksheet functions to count various types of cell contents.
- A neat VBA macro that counts every function used in all Excel formulas and presents a neat report as a result.
Note: for the VBA code to work, you'll need to save your workbook as an "Excel Macro-Enabled Workbook (*.xlsm)". The code also requires that each worksheet contains at least one formula and at least one non-formula (otherwise it will crash).
Full article: Count cells with text and formula – Excel stats
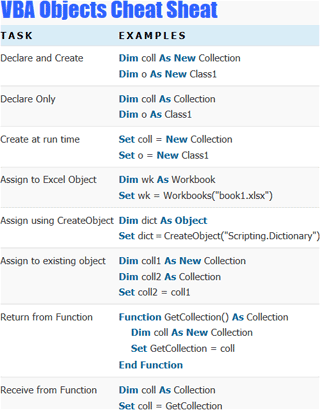
This is a comprehensive article about creating and using objects in Excel VBA.
If you are serious about learning VBA then it is important to understand VBA Objects. Using objects is not that difficult. In fact, they make your life much easier.
In this post, you will see how VBA makes brilliant use of objects. How objects such as Collections, Workbooks and Worksheets save you much complexity, time and effort.
Topics include:
- What is a VBA object?
- Object components.
- Creating a VBA object.
- Assigning VBA objects.
- VBA objects in memory.
- Why
Setis useful.
Full article: VBA objects – The ultimate guide
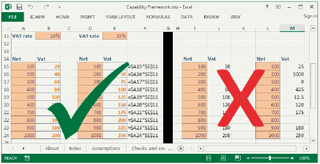
This spreadsheet competency framework is a structure for assessing ability and proficiency when using spreadsheets.
It can be used by recruitment agencies, companies, job seekers, training providers and anyone else who uses spreadsheets to carry out their role.
The framework consists of four key skill groups, described as levels. Each has its own expected core competencies, and other indicative skills:
- Basic user. Carries out data entry tasks in spreadsheets, and will have only the most fundamental knowledge necessary to be able to interact with a spreadsheet.
- General user. Modifies spreadsheets, rather than creates sophisticated spreadsheets from scratch.
- Creator. Uses spreadsheets as a primary element of their role, and needs to consider how to create and manage spreadsheets of a greater degree of complexity.
- Developer. Truly expert spreadsheet users, who are familiar with most of the core functionality of spreadsheet packages, and are able to develop high-complexity spreadsheets in a multi-user environment.
This competency framework builds on the twenty principles for good spreadsheet practice.
Full article: Spreadsheet competency framework
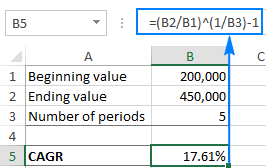
We explain what the Compound Annual Growth Rate (CAGR) is, and how to make a clear and easy-to-understand CAGR formula in Excel.
In simple terms, CAGR measures the return on an investment over a period of time. CAGR is often used by financial analysts, investment managers and business owners to figure out how their business has developed or compare revenue growth of competing companies.
We show four methods for calculating a CAGR:
- Create a CAGR calculator in Excel using an arithmetic equation.
- CAGR formula based on the
POWERfunction. - CAGR formula based on the
RATEfunction. - CAGR formula based on the
IRRfunction.
Full article: How to calculate CAGR in Excel
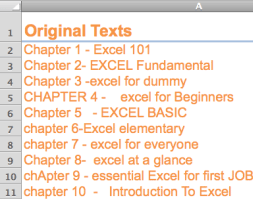
Writing a long formula is not easy, even for an advanced Excel user. What I mean long is a formula with many nested FUNCTIONS within a single formula. The difficulty I am talking about is not related to whether you understand the functions. It is more about the concentration and carefulness required for writing the formula.
The key to writing a long, complex formula is to break the formula into bite-size formulas with helper columns. This article illustrates the process using an example of converting poorly written text into a consistent format.
Full article: Writing a long formula in steps
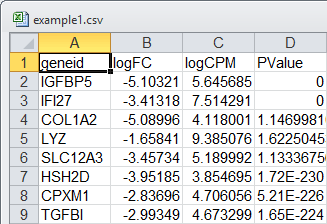
On 23 August a paper by three Australian authors gained much publicity about how Excel interprets data entry and how the users don't check their data.
The root problem is that the researchers who uploaded their data into Excel NEVER checked them. The reason they never check is because Excel is seen as a simple application, not programming or software development or data management.
Abstract of the source paper: "The spreadsheet software Microsoft Excel, when used with default settings, is known to convert gene names to dates and floating-point numbers. A programmatic scan of leading genomics journals reveals that approximately one-fifth of papers with supplementary Excel gene lists contain erroneous gene name conversions."
Full article: Excel & genes: mutation and curation
