30 April 2016
Whether it is in daily life or at work, we are always making comparisons to see what's good and what is not so good. This differential analysis is called variance analysis.
Here are 10 techniques to take variance analysis beyond simple numbers and percentages:
- Use brackets for negative numbers.
- Color the content or data – custom number format.
- Use arrows.
- Use cell color.
- Use arrows – Conditional Formatting.
- Use data bars.
- "In-cell" charts.
- Use scaled-down actual charts.
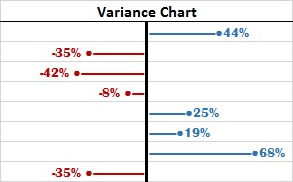
- Make better variance charts.
- Highlight instances in chart.
Full article: 10 ways to present variance analysis reports in Excel
