With Excel 2013, Microsoft introduced several new functions, one of which is worth a separate mention. FORMULATEXT displays as text the formula in a cell.
Full article: The Excel FORMULATEXT function
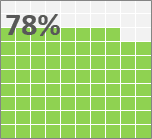
I've been toying around with Excel Waffle charts (sometimes called Square Pie Charts). It's an interesting visualization that I've recently used to display progress toward goal.
In this post, I'll walk you through the steps to set up a waffle chart template and how to duplicate it for as many metrics as you need.
Full article: Not available
The next time you notice something being done in Excel where you work, take a moment to question whether it's the right tool for the job, or whether you or someone in your organisation is a tool for allowing its use.
No, not my words, but from the FT's consistently excellent Alphaville blog. The point is, it's easy to use Excel. But it's very hard to use Excel well.
Full article: The right tool?
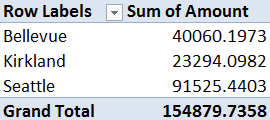
In many offices, there always seems to be at least one person who is referred to as an Excel expert/master/wizard. Their masterful status often originates from one fact: they can make a PivotTable. Are you jealous of this person? Have you ever wished you could have that glory for yourself instead? Do you secretly wonder what a PivotTable even is?
Full article: Choose your own PivotTable
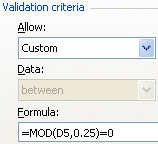
Data Validation is an excellent way to control data entry to meet a certain condition.
Suppose you want to insure that numbers entered in the yellow cells are OK for decimals, AND that only numeric increments of a quarter of a number are allowed. For example, the entry of 6.75 or 3.25 are allowed, but 4.35 or 1.62 are not allowed.
The following steps show how this can be done.
Full article: Using Data Validation to force a decimalized numeric entry
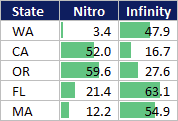
I've emphasized before that the key behind visual design is that every formatting decision you make should have a purpose behind it. In the following post, I plan to demonstrate more of the visual style I use in Excel:
- Dark background and white font.
- Soft gray lines.
- Dotted lines.
- White borders.
- Custom trim.
- Uniform column widths.
- Pastel highlighting.
- Excel data bars instead of color scales.
Full article: Excel visual design tricks
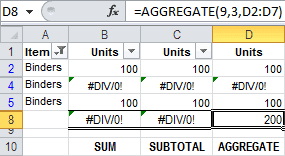
The SUBTOTAL function is great for calculating totals on a filtered list in Excel. Unlike the SUM function, SUBTOTAL ignores the values in rows hidden by the filter, and can even ignore manually hidden rows, so the total includes only the visible cells.
A new function, AGGREGATE, introduced in Excel 2010, is similar to SUBTOTAL, and has a couple of advantages.
Full article: Sum a filtered list with AGGREGATE function
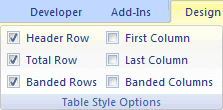
Over the next few articles we will explore the usage of Excel tables which are a powerful feature of Excel.
We will look at when to use them and when not to use them, the advantages over using plain tables - simple ranges - and a few of disadvantages of using them.
We will also go through a practical example of building a spreadsheet to manage your current account, which will highlight many key points of using Excel tables.
See:
Full article: Excel Tables
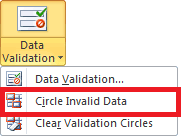
You may have imported or entered account codes into a Microsoft Excel spreadsheet and want to identify invalid account codes. Let's say the account codes are supposed to have five characters but because of data entry errors some accounts codes do not meet the required criteria; they either exceed or are less than five characters.
By using the Data Validation option to circle invalid data the invalid account codes will be circled and therefore easily identifiable. It must be noted that data validation will have to be applied before circling invalid data. Circling Invalid Data can only be applied with data that has already been captured, unlike with Data Validation which can also be applied prior to data being captured.
Full article: Circling invalid data
