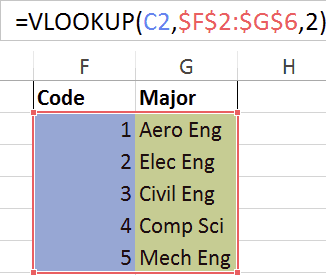
By default, Excel (and most other spreadsheet systems too) return approximate matches when using the VLOOKUP function.
There is a benefit in using the approximate match, it is quicker (as binary search is used) but for small spreadsheets the difference is negligible.
The interesting thing is that there are risks associated with using the approximate match. Because it uses binary search it requires the search range to be sorted. If not, funky things can happen.
Full article: VLOOKUP considered harmful
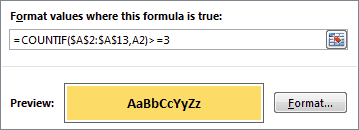
The COUNTIF function is one of the most useful functions in Excel. Its job is to provide conditional counting. This is primarily used for analysing data and producing reports and dashboards.
In this blog post we look into 5 more unorthodox but useful scenarios for the COUNTIF function to be used. The 5 COUNTIF examples we look at are:
- Prevent duplicates in a range.
- Uniquely rank items in a list.
- Count the unique entries in a list.
- Compare two lists.
- Identify names that occur 3 times or more.
Full article: 5 alternative reasons to use COUNTIF function
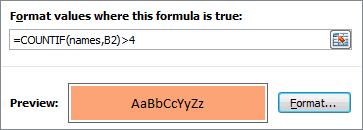
Excel has a great tool for visualizing data called Conditional Formatting. If you work with data in Excel (and who doesn't these days?) you'll find it incredibly useful. By creating simple rules that highlight just the data you are interested in, you can spot key information very quickly.
To help get you started, and to give you some inspiration, here are some cool ways that you can use conditional formatting to help you work with data faster:
- Highlight duplicate or unique values.
- Highlight top or bottom values.
- Highlighting values based on a variable input.
- Highlight entire rows based on values in a column.
- Highlight rows based on an input cell.
- Build a search box.
Full article: Cool things you can do with conditional formatting
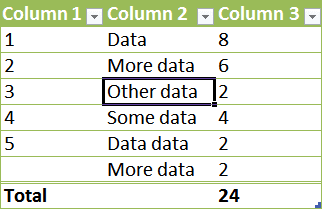
With the introduction of Tables in Excel 2007, we were also provided a new syntax for referencing Tables and the parts within those Tables. This new syntax is called structured referencing.
As you will see in this article, structured referencing is a very powerful tool that makes your formulas dynamic while maintaining significant simplicity.
Full article: Structured referencing to identify parts of Excel tables
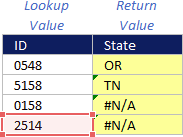
INDEX MATCH not working? This article provides the most likely causes of your problems with using INDEX MATCH.
If you're an advanced user of Excel, you've likely already made the switch from VLOOKUP to INDEX MATCH because of the several advantages that INDEX MATCH provides.
Within Excel, INDEX MATCH is one of the most prevalent formula combinations available. Despite this popularity, INDEX MATCH is by no means perfect and is still prone to errors. The following examples represent the most common mistakes made when using the formula combination.
Full article: Top mistakes made when using INDEX MATCH
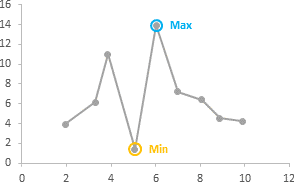
This article shows you how to automatically highlight the minimum and maximum points in a chart. Using an automated approach avoids the problems associated with manually highlighting chart data.
This approach, of adding a series for any data you want to highlight, is very flexible. You don't need to only highlight minimum or maximum values, you can highlight anything that you can write a formula for.
Full article: Highlight min and max data points in an Excel chart
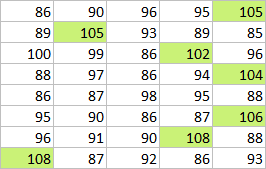
If you've ever applied conditional formatting with your own formula, you know the hardest part is making sure the formula actually works. The problem is that the formula area in a conditional formatting rule isn't very friendly. You don't get highlighted cell references, you don't get function autocomplete...heck....you don't even get screen tips.
Luckily, there's an easy fix: use dummy formulas to test your conditional formatting.
Full article: Test conditional formatting with dummy formulas
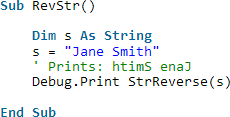
Using strings is a very important part of VBA. There are many types of manipulation you may wish to do with strings.
The good news is that VBA contains plenty of functions to help you perform these tasks with ease. This post provides an in-depth guide to using strings in VBA. It explains strings in simple terms with clear code examples that can easily be used as a quick reference guide.
Full article: The ultimate guide to using strings in Excel VBA

One of the age-old accusations against Excel is that it is error-prone.
According to research, the error rates in spreadsheets are roughly the same as in other types of activities with a similar level of complexity (such as computer programming), i.e. around 3%-5%.
The big difference is that this is recognised in software companies, whose testing processes tend to reduce this rate considerably, whereas most spreadsheet development is carried out in a much less rigorous environment.
It's not that spreadsheets are error-prone, it's that the errors aren't removed by rigorous testing.
Full article: Is Excel error-prone?
