
Once you've created a spreadsheet or you get one from someone else, one of the more painful things you end up doing at some point is trying to work out which cells feed into any of the formulas throughout the workbook or alternatively, which cells are dependent on any given cell(s).
So how can you check this without spending hours looking at all the cells in your worksheet/workbook? This is where the FORMULA AUDITING tools come in.
Full article: Using the Formula Auditing tools

You may want some way of pausing or delaying VBA code execution and you can do this with two functions called Wait and Sleep. You can also do this using a loop, and we will look at that approach too.
Why would you pause the code? Maybe you need to wait for another task to finish, for instance if you made a call to a Windows API/shell function. Or you may want to wait for the user to update data in the sheet, or you just want to run a macro at a set time.
Full article: Pausing or delaying VBA using Wait, Sleep or a loop
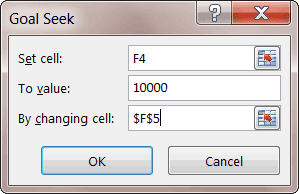
Today's post is about the Goal Seek Method of the Range Object of the Excel Object Model.
I can use Goal Seek to manually find a value, but what if I need to find values for 12 different months? 52 Weeks? Some other scenario with 100's of desired outputs? Time for some VBA!
Full article: Begin with the end in mind
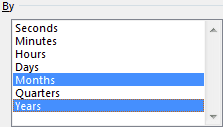
PivotTables are one of the most useful tools in Excel. They allow you to easily summarise, examine and present a complex list of data.
This blog post explores 5 advanced PivotTable techniques:
- Grouping fields by month and year.
- Calculating data as a percentage of the total.
- Using Slicers.
- Applying Conditional Formatting to PivotTable data.
- Creating calculated fields.
Full article: 5 advanced PivotTable techniques
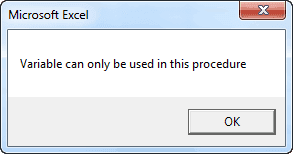
The scope of a variable in Excel VBA determines where that variable may be used. You determine the scope of a variable when you declare it. There are three scoping levels: procedure level, module level, and public module level.
This article describes VBA variable scope, including examples.
Full article: Variable scope in Excel VBA
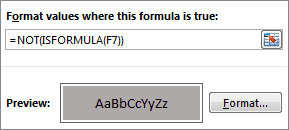
How do you know when a user has entered a value into a formula cell, essentially overriding your formula?
Starting with Excel 2013, we can use conditional formatting with the new ISFORMULA function to highlight when this happens.
Full article: Formula override Conditional Formatting alert

This post shows a simple technique that will vastly reduce the number of errors in your VBA code.
The simple technique is the Assertion statement. It is simple to use and implement and will provide dramatic results. However don't be fooled by the simplicity of Debug.Assert. Used correctly it is an incredibly powerful way of detecting errors in your code.
Full article: How to reduce VBA errors by up to 70%
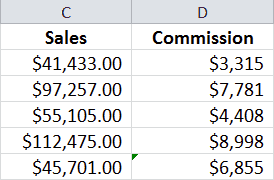
Today we look at Excel's built-in feature that flags inconsistent formulas, and see how that feature can call attention to potentially critical information lurking beneath the surface.
Excel's way of telling you that the formula underneath a cell is not like the others is to display a small green triangle in the upper left-hand corner of the cell.
Full article: Detecting inconsistent formulas
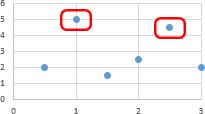
Is there any way to make a shape stick to a point in a scatterplot, not an absolute location on the chart?
Of course. There is actually a pretty simple way to make the shapes stick to the points. This article shows you how.
Full article: Stick a shape to a point in an Excel chart
