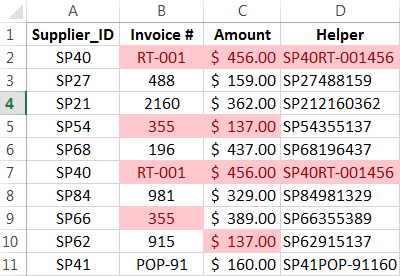
Excel can be used to conduct a forensic audit, gathering evidence of possible fraud.
We cannot eliminate mistakes or "fudging" in financial data, however we can positively try to minimize it.
Here are five techniques that can be applied using Excel for tracing such issues:
- Identifying duplicate transactions using highlight values.
- Analyzing round numbered transactions.
- Above average payments to vendors or checking the ratio between a maximum and minimum.
- Gap detection.
- Checking ratio of the highest to the second highest number.
Full article: Five ways to perform a forensic audit using Excel

Excel projects of any significance are very often complicated. Documenting such projects is crucial for auditing and maintainability.
Fortunately, Microsoft provides several options for documenting Excel projects:
- Workbook name and path.
- Workbook Properties.
- Model structure.
- Titles.
- Value labels.
- Names and Structured References.
- Cell Comments.
- Text boxes.
- Data Validation.
- Hyperlinks.
- Documentation worksheets.
- External documentation.
[Note: The article also suggests using the N() function to include documentation in a formula. This is a risky practice that may result in errors. iⁿ advises not to use the N() function for documentation.]
Full article: Documenting Excel projects
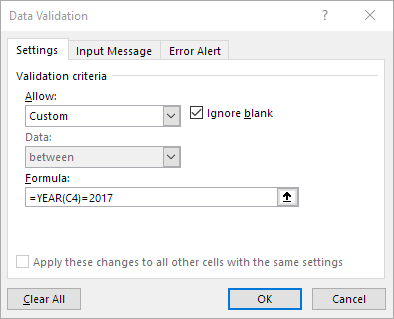
Excel's data validation feature is underused because many users don't realize how versatile it is, especially where dates are concerned.
Dates seem to complicate things, but only in your head! This feature handles dates fine.
Here are four ways to express dates using data validation:
- Literal values. Just enter the first and last acceptable dates.
- Input values. Refer to input cells instead of entering literal date values.
- A dynamic list. Create the date list as a Table, so the validation updates as you modify the list.
- Formulas. Create a formula to validate the dates. This approach is dynamic and very flexible.
Full article: Four ways to specify dates using Excel data validation
With the hype of deep learning neural nets, and machine learning algorithms, it's easy to forget that most of the work in data science involves accessing and preparing data for analysis. Indeed, not all data is Kaggle-ready. The reality is: data is often far from perfect.
Do your consultant (and budget) a favor and follow these rules-of-thumb when using spreadsheets to collect and organize your data:
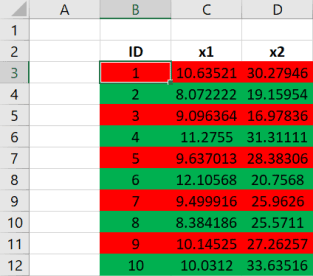
- Do not rely on spreadsheet formatting to indicate associations in your data.
- Never merge spreadsheet cells.
- Always use Data Validation tools for data entry.
- Never (ever!) delete rows of data if you want the data excluded from the analysis.
- Create a key that explains each column of data in a table.
- Preserve the integrity of the data by separating the data from the analysis.
- Use a fixed spreadsheet template and collect data in a series of spreadsheet files (rather than a series of tabs in a file).
Full article: 7 rules for spreadsheets and data preparation for analysis and machine learning
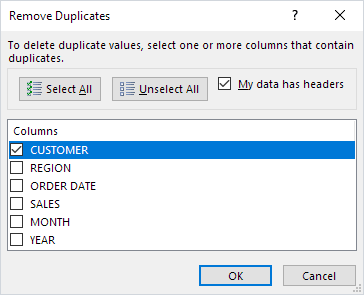
Data cleansing is an important activity within Excel and one that we find ourselves doing day in day out, sometimes without even knowing it.
My top data cleansing techniques are:
- Unpivot data.
- Find & Replace.
- Find errors with Go to Special constants.
- Find blank cells in Excel with a color.
- Remove duplicates in an Excel table.
- Text to Columns: Dates.
- Using formulas to clean data.
- Excel add-Ins.
Full article: Top Excel data cleansing techniques
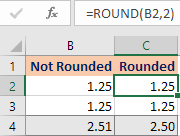
This article describes a situation where there was a significant difference between the calculated and expected values.
The problem was caused by the way that Excel rounds values for display purposes, but the formula is calculating using the actual cell content.
Using the ROUND function can help resolve this type of problem.
Full article: Displaying decimals versus Rounding in Excel
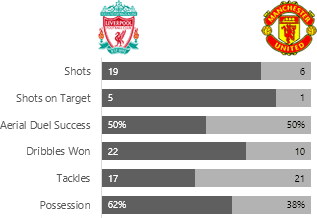
When you think of visualizing parts to a whole in Excel charts the first thing that's likely to come to mind is the pie chart, or if you're Homer Simpson then you might think of doughnut charts!
Using football as inspiration, let's look at our options for visualizing parts to a whole data using a standard set of football statistics.
Chart types explored in this article include:
- Pie chart.
- Doughnut chart.
- 100% Stacked Column/Bar chart.
- Stacked area chart.
- Line chart.
- Treemap.
- Sunburst.
- Layered bar chart.
- Marimekko.
Full article: Visualizing parts to a whole in Excel charts
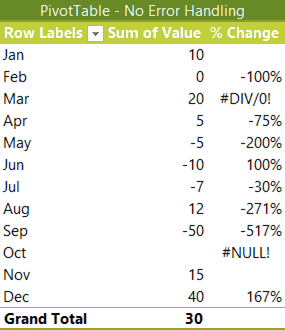
Obviously, we don't want our PivotTables littered with #DIV/0! and #NULL! errors if we're presenting them in a report. That would just create unnecessary questions and we're busy enough.
Thankfully Excel PivotTable error handling is easy to control via the PivotTable Options. This article shows you how.
As a bonus, this article also discusses what to display when the prior period was zero. Specifically, is the percentage change from nothing to something equal to 100%?
Full article: Excel PivotTable error handling
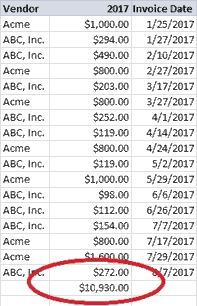
Mastering Excel takes some experience and patience, but it's easy to make mistakes even if you've been using it for a long time. Sometimes, choices seem like a brilliant idea—until they're not, and the resulting problems are hard to troubleshoot.
In this article, I share 10 ways to avoid actions that seem good... at the time:
- Rely on multiple links.
- Destroy data.
- Rely on default settings.
- Ignore Table objects.
- Use Excel as a database or Word processor.
- Forget to protect your work.
- Leave blanks.
- Use numbers as column headings.
- Allow error values.
- Sluff off backups.
Full article: 10 things you should never do in Excel
