When applying Conditional Formatting, you may have situations where you don't want to apply your rule to certain cells in a range.
Excel provides a clever Conditional Formatting mechanism called "Stop If True". This allows you to specify when Excel should stop evaluating/formatting values if a condition is true.
Full article: Using Stop If True when Conditional Formatting

Pies charts are fun to use, but it's almost impossible for grown-ups to find a good reason for using them at work. So your first, safe-for-work choice is a bar chart. The boring bar chart. I don’t like bar charts.
So, here are some reasons why I don't like bar charts:
- Have to be sorted.
- Very low data density (inefficient encoding).
- Very sensitive to scale breaks.
- Forces you to use color.
- Feels cluttered.
- Accepts very few data points.
- It's difficult to compare data points in a stacked bar.
- The second axis can be misleading.
Full article: Why I don't like bar charts

Did you know that you can format several of your charts in a workbook at once? Here is how to copy chart formatting.
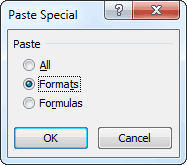
Select and copy the chart you formatted. Select the chart you want all formatting to be applied and then select Paste Special from Home ribbon. Excel will ask you what to paste. Select Formats option. Now your chart has the same formatting as the one you manually formatted.
Full article: Copy chart formatting

Of all the hundreds of formulas & thousands of features in Excel, INDEX() would rank somewhere in the top 5 for me. It is a versatile, powerful, simple & smart formula. Although it looks plain, it can make huge changes to the way you analyze data, calculate numbers and present them.
7 reasons why INDEX is an awesome companion:
- Get nth item from a list.
- Get the value at intersection of given row & column.
- Get entire row or column from a table.
- Use it to lookup left.
- Create dynamic ranges.
- Get any 1 range from a list of ranges.
INDEXcan process arrays.
Full article: 7 reasons why you should get cozy with INDEX()

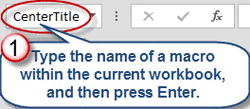
It's pretty much impossible to use Excel and not notice the Name Box, which appears just above the upper-left-hand corner of the worksheet frame. Most users know this as the space in Excel where you can determine the address of the currently selected cell. A smaller subset of users relies on the Name Box as a navigation aid. However, that unobtrusive rectangle belies a dizzying array of functionality in Microsoft Excel.
Full article: Twenty-five ways to use Excel's Name Box

Having spent a lot of time creating the perfect workbook, setting it just how you need it ready to do other important work, you send it out to people around the office or business, or perhaps you place it on a shared drive for everyone to access, only to find that within days, or even hours, some bright spark doesn’t like your layout and changes it around to suit them regardless of the fact that it was set up in a particular way for a specific reason.
This is where we need PROTECTION.
Full article: Excel - Protecting your worksheets and workbooks

To reduce errors in Excel reports, you should foot and cross-foot them. But Excel's floating-point arithmetic gets in the way. Here's how to get around this problem.
Full article: How to foot and cross-foot excel reports in a floating-point world

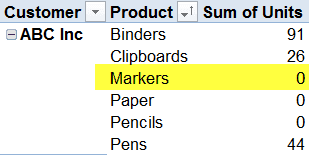
When you create a pivot table from your source data, it only shows the items that have data. For example, if you put Customers and Products in the Row area, it only lists the items that each customer has bought.
In this article we'll see how to show items with no data in some records, show zeros in empty cells, and show items that have no data at all.
Full article: How to show missing items in Pivot Table

I use Regular Expressions (or RegEx) for data validation in Excel 2010. It is extremely fast, very flexible and powerful in the sense that its logic will only ALLOW the exact data you want to be processed - everything else will be validated as invalid.
Using Regular Expressions negate the use of multiple If, Then, Else or Case statements. This article will cover validating different types of data using a simple Regular Expression Subroutine. I will also provide an IsValid Regular Expression Function and some common Regular Expression patterns for you to try out.
Full article: How to use Regular Expression for data validation in Excel 2010
