26 May 2017
PivotTables in Excel are pretty awesome. In just a few clicks, you can build a detailed report that gives you quick and important insights into your data.
If you polish your PivotTables in the right way, your data and associated reports will be so much more valuable to your friends, colleagues or your manager.
In this post you'll get a wide range of tips to improve your PivotTables, including various shortcuts and hints that may have never heard about:
- Refresh your data source (to ensure your report is correct).
- Disable AutoFit Column Widths.
- Sort your data to answer the real questions.
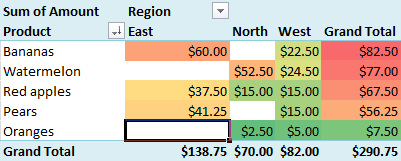
- How should blank cells be presented?
- Change Subtotal options.
- Group dates together (by Week, Month, Quarter, Year…).
- Show values as a percentage or rank.
- Apply a Style to your PivotTable to align with your branding.
- Support your PivotTable with a PivotChart.
- Analyse relevant data in detail by double-clicking a cell.
- Add Slicers to enable quick filtering.
Full article: Polish your PivotTables with these excellent tips
