10 June 2017
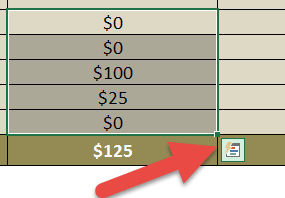
In Excel (2013 or above version), whenever you select some data from a range of cells you get a small icon on the bottom right hand corner - it is called QUICK ANALYSIS.
I want to inspire you to use this tool, and for this I have listed 5+1 amazing things which you can do with the quick analysis option and which will save you a lot of time!
Some of the tasks that you can accomplish with the Quick Analysis tool are:
- Add running total.
- Create a Pivot Table.
- Recommended charts.
- Percentage share.
- Insert a sparkline.
- Highlight greater than values.
Full article: 5 + 1 reasons you should use Excel's Quick Analysis option
