7 February 2018
A common problem around web forums and blogs is how to plot blank cells in Excel charts.
There is a lot of confusion about plotting of hidden and empty cells, about what constitutes a blank cell, and about various workarounds that purport to produce blank cells that will or will not be displayed in a chart.
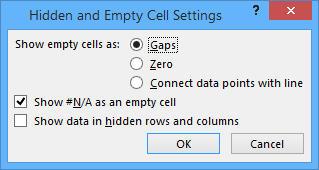
A new feature in Excel 2016, Show #N/A as an empty cell, solves the pain and frustration experienced by generations of Excel users trying to avoid plotting what look like apparently blank cells.
Full article: Plot blank cells and #N/A in Excel charts
