Authors
Roxanne Leitao & Chris Roast
Abstract
Spreadsheets are widely used within science, technology, engineering and maths education. Despite their widespread use, end-user spreadsheet errors are still extremely common and have been shown to have an adverse effect on learning.
The textual representation of formulas can be particularly complex and error-prone, exacerbating barriers to dyslexic users. Our work focuses on the design and development of a visual language to graphically represent spreadsheet formulae, with the objective of making them easier to understand than their default textual form.
This work contributes to a body of human factors research focused upon spreadsheets.
Sample

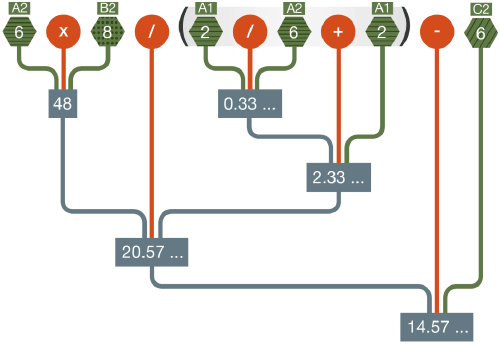
The explicit visualisation approach graphically represents each step in the process of executing a formula. In this example the formula is: =A2*B2/(A1/A2+A1)-C2. The visualisation computes results at every step and provides a more explicit view of the process and results within a formula.
Publication
2014, Workshop on Mathematical User Interfaces, July
