Authors
Sohon Roy & Felienne Hermans
Abstract
Spreadsheet cells contain data but also may contain formulas that refer to data from other cells, perform operations on them, and render the results directly to show it to the user.
In order to understand the structure of spreadsheets, one needs to understand the formulas that control cell-to-cell dataflow. Understanding this cell-to-cell inter-relation or dependence tracing is easier done in visual manners and therefore quite a few techniques have been proposed over the years.
This paper aims to report the results of an investigative study of such techniques. The study is a first step of an attempt to evaluate the relevance of these techniques from the point of view of their benefits and effectiveness in the context of real world spreadsheet users.
Results obtained from such a study will have the potential for motivating the conception of newer and better techniques, in case it is found that the need for them is still not fully catered.
Sample

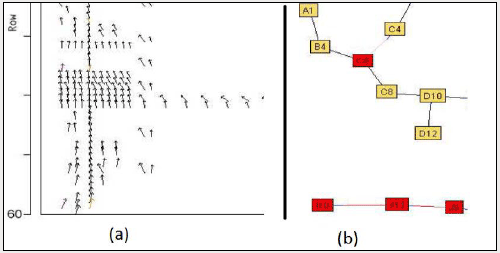
Visulaization techniques often use abstractions that emphasize layout and dependency rather than cell values. In this example, data dependencies are shown using: (a) vector map, and (b) spring view graph structure.
Publication
2014, First Workshop on Software Engineering Methods in Spreadsheets, July
Full article
Dependence tracing techniques for spreadsheets: An investigation
