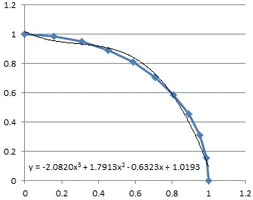
A frequent question on internet forums everywhere is how to do a least squares fit of a non-linear trend line to a set of data.
The most frequent answer is to plot the data on an XY (“scatter”) chart, and then use the "Fit Trendline" option, with the "display equation on chart" box checked. The chart trendlines have the options of: Linear, Exponential, Logarithmic, Polynomial (up to order 6), and Power. There is also a "Moving Average" option, but this does not provide a trendline equation.
The chart trendline solution is OK if what you want to do is display the trendline equation on a chart, but if you want to use the numbers in some further analysis, or even just display them elsewhere in the spreadsheet, or copy them to another document, it is far from convenient. Fortunately it is straightforward to get the trendline equations (and other statistics) for each of the chart trendline types using the LINEST worksheet function.
Full article: Using LINEST for non-linear curve fitting
