26 January 2014
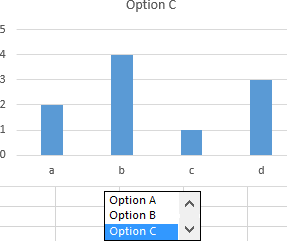
If you're making a dashboard-style report in Excel, you may prefer that a chart not be cluttered with all of the available data, but instead allow the report consumer select which set of data to analyze.
This post shows you how to create simple interactive charts in Excel, using the built-in list and option controls.
Full article: Simple interactive charts in Excel
