Authors
J. Steve Davis
Abstract
Few tools are available for understanding and debugging spreadsheets, but they are needed because spreadsheets are being used for large, important business applications.
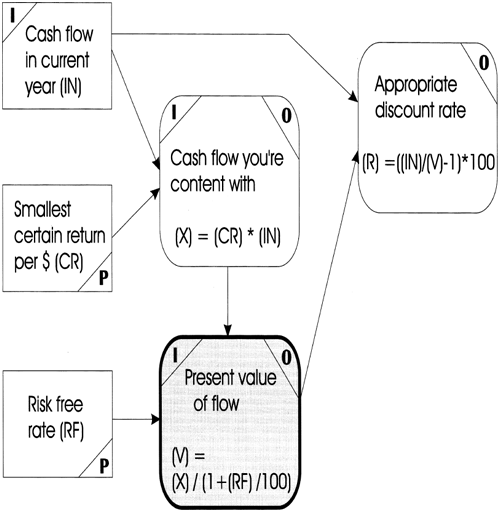
The key to understanding spreadsheets is to clarify the data dependencies among cells. We developed and evaluated two interactive tools which aid in investigating data dependencies, an on-line flowchart-like diagram and a tool which represents dependencies by drawing arrows among cells on the display of the spreadsheet.
Users found both tools helpful, but preferred the arrow tool.
Sample

The tool displays the spreadsheet in a window on one side of the screen and the diagram in a window on the other side.
Publication
1996, International Journal of Human-Computer Studies, Volume 45, number 4, October, pages 429-442
