Authors
Richard Brath & Michael Peters
Abstract
Visualizing spreadsheet content provides analytic insight and visual validation of large amounts of spreadsheet data.
Oculus Excel Visualizer is a point and click data visualization experiment which directly visualizes Excel data and re-users the layout and formatting already present in the spreadsheet.
Sample

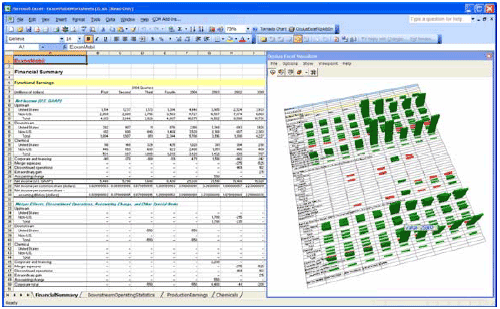
A simple spreadsheet from an annual report. On the left is an income statement with a variety of formatting and on the right is Excel Visualizer viewing the same data.
We have applied WYSIWYG to spreadsheets as follows:
- The visualization uses the same row and column cell structure for organizing the scene.
- Text data in the spreadsheet continues to be represented as text within cells in the visualization.
- Numeric data is represented as graphical objects (bars by default) in the visualization.
- Wherever possible all other spreadsheet formatting (cell background color, cell borders) are re-used within the visualization.
Publication
2006, EuSpRIG
Full article
Spreadsheet validation and analysis through content visualization
