Authors
Margaret Burnett, Andrei Sheretov, & Gregg Rothermel
Abstract
Although there has been considerable research into ways to design visual programming environments to improve the processes of creating new programs and of understanding existing ones, little attention has been given to helping users of these environments test their programs. This feature would be particularly important for systems aimed at end users, since testing is the primary device they use to determine whether their programs are correct.
To help address this need, we introduce two visual approaches to testing large grids in spreadsheet systems. This work scales up a visual testing methodology we previously developed for individual cells. The approaches are tightly integrated into Forms/3, a visual spreadsheet language, and communication with the user happens solely through the use of checkbox devices and coloring mechanisms.
The intent of this work is to bring to end users at least some of the benefits of formalized notions of testing, without requiring knowledge of testing beyond a naive level.
Sample

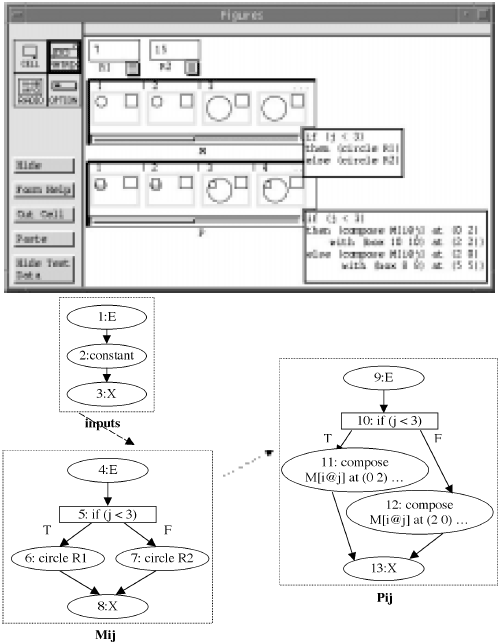
Top: Regions of cells are identified.
Bottom: In the Region Representative approach, a region's shared formula is modeled by the formula graph of one representative of that region.
Publication
1999, IEEE Symposium on Visual Languages, September, pages 30-37
Full article
Scaling up a "What You See Is What You Test" methodology to spreadsheet grids
