Authors
Jorma Sajaniemi
Abstract
Computations in spreadsheets are hard to grasp and consequently many errors remain unnoticed. The problem with the hidden errors lies in the invisibility of the structure of calculations. As a result, auditing and visualization tools are required to make spreadsheets easier to comprehend and errors easier to be detected.
This paper presents a theoretical model of spreadsheets, and describes various spreadsheet auditing mechanisms employing the model. Moreover, two new visualization mechanisms are introduced.
The model reflects not only current spreadsheet systems but also the way people actually use spreadsheets. Theoretically, it is impossible to check the correctness of a spreadsheet without a formal definition of its computations, but our hope is to find visualizations that point out parts of spreadsheets that contain anomalies, i.e., potential locations of errors. The model helps us to understand how such anomalies can be defined.
Sample

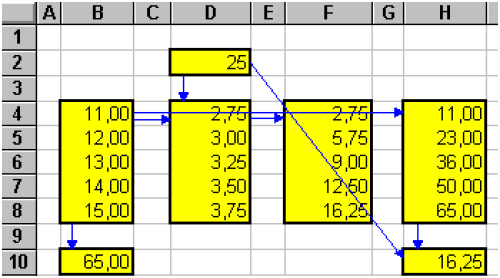
We have developed a visualization that highlights the data flow of a spreadsheet as well as areas containing formulae or data that seems to form a logical entity.
This visualization marks with yellow coloring and a thick border areas (so called S areas) that contain values having equal type and equal format as well as areas having a formula that could be obtained by copying from each other.
Publication
1998, Journal of Visual Languages & Computing, Volume 11, Number 1, February, pages 49-82
