Authors
Karin Hodnigg & Roland Mittermeir
Abstract
Legacy spreadsheets are both, an asset, and an enduring problem concerning spreadsheets in business. To make spreadsheets stay alive and remain correct, comprehension of a given spreadsheet is highly important.
Visualization techniques should ease the complex and mindblowing challenges of finding structures in a huge set of spreadsheet cells for building an adequate mental model of spreadsheet programs.
Since spreadsheet programs are as diverse as the purpose they are serving and as inhomogeneous as their programmers, to find an appropriate representation or visualization technique for every spreadsheet program seems futile.
We thus propose different visualization and representation methods that may ease spreadsheet comprehension but should not be applied with all kind of spreadsheet programs. Therefore, this paper proposes to use (complexity) measures as indicators for proper visualization.
Sample

Spreadsheet programs are usually seen as relatively simple arrangements of a few formula or data cells.
But often spreadsheets are highly complex and any attempt aiming at comprehending the sheet by simply perusing all cells (or only all formula cells) is bound to failure by exhaustion.
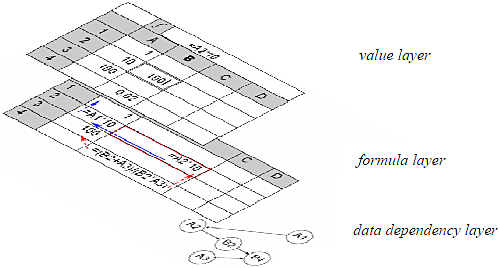
Every spreadsheet programmer is confronted with three layers:
- The value layer, where the resulting values (including a potential formatted representation) of every cell are presented.
- The underlying formula layer, which shows the structure of the formulas.
- The layout-independent data dependency graph.
Publication
2008, EuSpRIG
Full article
Metrics-based spreadsheet visualization: Support for focused maintenance
