Authors
Felienne Hermans, Martin Pinzger, & Arie van Deursen
Abstract
Spreadsheets are used extensively in business processes around the world and just like software, spreadsheets are changed throughout their lifetime causing maintainability issues.
This paper adapts known code smells to spreadsheet formulas. To that end we present a list of metrics by which we can detect smelly formulas and a visualization technique to highlight these formulas in spreadsheets.
We implemented the metrics and visualization technique in a prototype tool to evaluate our approach in two ways. Firstly, we analyze the EUSES spreadsheet corpus, to study the occurrence of the formula smells. Secondly, we analyze ten real life spreadsheets, and interview the spreadsheet owners about the identified smells.
The results of these evaluations indicate that formula smells are common and that they can reveal real errors and weaknesses in spreadsheet formulas.
Sample

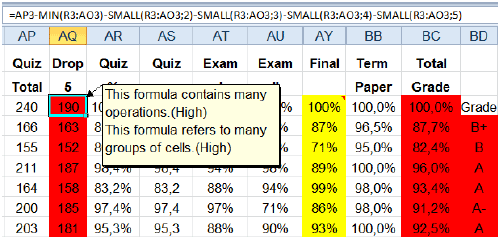
A colored overlay on the spreadsheet indicates the formula smells (yellow for low; orange for moderate and red for high). We call this the spreadsheet risk map.
A comment is attached to each colored cell, providing a brief explanation about the smell.
Publication
2011, Delft University of Technology, TUD-SERG-2011-030
Full article
Detecting code smells in spreadsheet formulas
Also see
Detecting and visualizing inter-worksheet smells in spreadsheets
