Authors
Felienne Hermans, Martin Pinzger, & Arie van Deursen
Abstract
Thanks to their flexibility and intuitive programming model, spreadsheets are widely used in industry, often for business-critical applications. Similar to software developers, professional spreadsheet users demand support for understanding spreadsheets, and analyzing their quality.
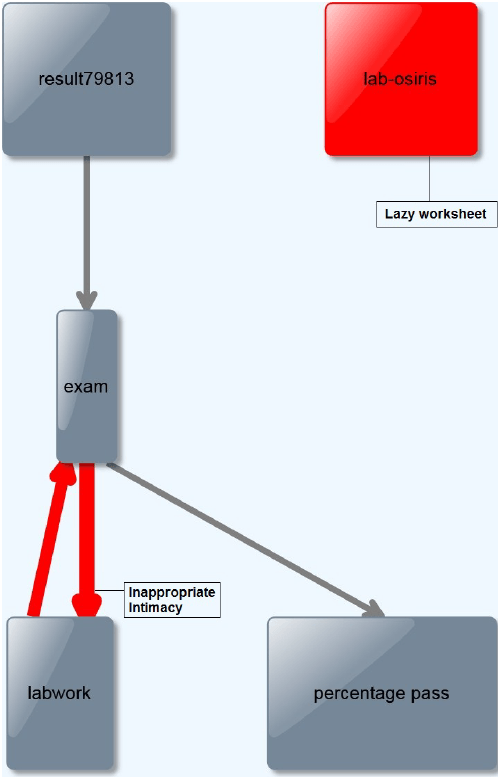
This paper describes Breviz, a tool that visualizes spreadsheets as leveled dataflow diagrams, showing users all worksheet in a spreadsheet and the data that is flowing between them.
Initially, we used these diagrams to support spreadsheet users in explaining and transferring spreadsheets to colleagues. In further studies of the tool however, we have seen that the visualization is also useful to help detect anomalies in the spreadsheet.
Sample

This is an example of the output of Breviz with the smell detection module enabled.
Publication
2010, Delft University of Technology, Software Engineering Research Group, Technical Report Series
