Authors
Simone Schalkwijk, Felienne Hermans, Michiel van der Ven, & Hans Duits
Abstract
Spreadsheets are known to be error-prone. Over the last decade, research has been done to determine the causes of the high rate of errors in spreadsheets.
This paper examines the added value of a spreadsheet tool (PerfectXL) that visualizes spreadsheet dependencies and determines possible errors in spreadsheets by defining risk areas based on previous work.
This paper will firstly discuss the most common mistakes in spreadsheets. Then we will summarize research on spreadsheet tools, focussing on the PerfectXL tool. To determine the perceptions of the usefulness of a spreadsheet tool in general and the PerfectXL tool in particular, we have shown the functionality of PerfectXL to several auditors and have also interviewed them.
The results of these interviews indicate that spreadsheet tools support a more effective and efficient audit of spreadsheets; the visualization feature in particular is mentioned by the auditors as being highly supportive for their audit task, whereas the risk feature was deemed of lesser value.
Sample

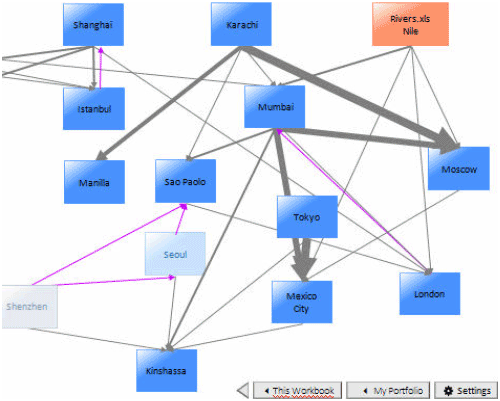
The visualization functionality in PerfectXL shows dependencies between sheets. External sources linked to a sheet are recognizable by the orange colour. Hidden and very hidden sheets are presented as relatively light blue and grey blocks. Thick arrows between the blocks indicate large dependencies.
Publication
2015, EuSpRIG
