Authors
Markus Clermont
Abstract
This paper presents a toolkit for spreadsheet visualization based on logical areas, semantic classes and data modules. Logical areas, semantic classes and data modules are abstract representations of spreadsheet programs that are meant to reduce the auditing and comprehension effort, especially for large and regular spreadsheets.
The toolkit is integrated as a plug-in in the Gnumeric spreadsheet system for Linux. It can process large, industry scale spreadsheet programs in reasonable time and is tightly integrated with its host spreadsheet system.
Users can generate hierarchical and graph-based representations of their spreadsheets. This allows them to spot conceptual similarities in different regions of the spreadsheet, that would otherwise not fit on a screen. As it is assumed that the learning effort for effective use of such a tool should be kept low, we aim for intuitive handling of most of the tool's functions.
Sample

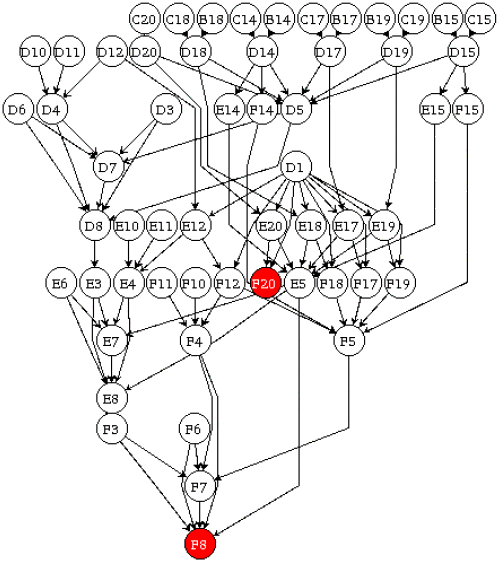
The way a spreadsheet works can be reconstructed by examining the cell dependencies, in the form of a data-dependency graph.
This is the data-dependency graph of a small example spreadsheet with 68 nodes and 86 edges. Sink nodes are colored red.
Publication
2004, EuSpRIG
