Authors
Bennett Kankuzi & Jorma Sajaniemi
Abstract
Earlier research on spreadsheet authors' mental models has shown that people possess several types of information about spreadsheets.
The research results also suggested that a tool intended to aid in comprehension and debugging of spreadsheets should make prominent real-world and problem domain concepts and map them easily to spreadsheet-specific details.
This poster introduces a new spreadsheet visualization tool which was developed to demonstrate that it is possible to have an easy-to-use spreadsheet understanding and debugging tool that relieves users from spreadsheet details and lets them utilize more of their mental model of the application domain.
The tool translates traditional spreadsheet formulas into problem domain narratives and highlights referenced cells.
Sample

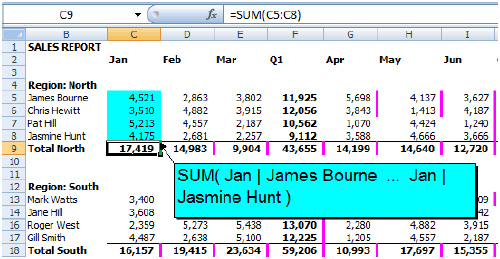
The cell cursor is in C9, whose formula is visible at the formula bar and narrated in domain terms in the light green box.
Cells referred to in the domain narrative are highlighted with light green background. All formula cells are marked with a pink right border.
Publication
2014, IEEE Symposium on Visual Languages and Human-Centric Computing (VL/HCC), July
